
Introduction
Modern distributed systems break in surprising ways. When something goes wrong, you need more than just logs — you need to know what happened, when, and why, across all your services at once. That’s what observability is about.
There are three main types of telemetry data, each answers a different question:
- Metrics — What’s happening? (how many requests, how many errors, how fast)
- Traces — Where is it happening? (follow a request across all services)
- Logs — Why is it happening? (detailed event messages)
In this article, we’ll build a complete observability setup for two .NET microservices — a Catalog API and an Order API — using:
- OpenTelemetry — a standard way to collect telemetry from any stack
- OpenTelemetry Collector — receives, processes, and routes data to backends
- Prometheus — stores and queries metrics
- Tempo — stores and queries traces (with span metrics generation)
- Loki — stores and queries logs (native OTLP support in v3.x)
- Elasticsearch + Kibana — second log backend with rich search
- Grafana — one dashboard for metrics, traces, and logs
- PostgreSQL — a separate database per microservice
Architecture Overview
OpenTelemetry is a CNCF (Cloud Native Computing Foundation) project that gives you one standard way to collect telemetry. Instead of wiring each backend separately, you instrument once and the collector sends data wherever you need.
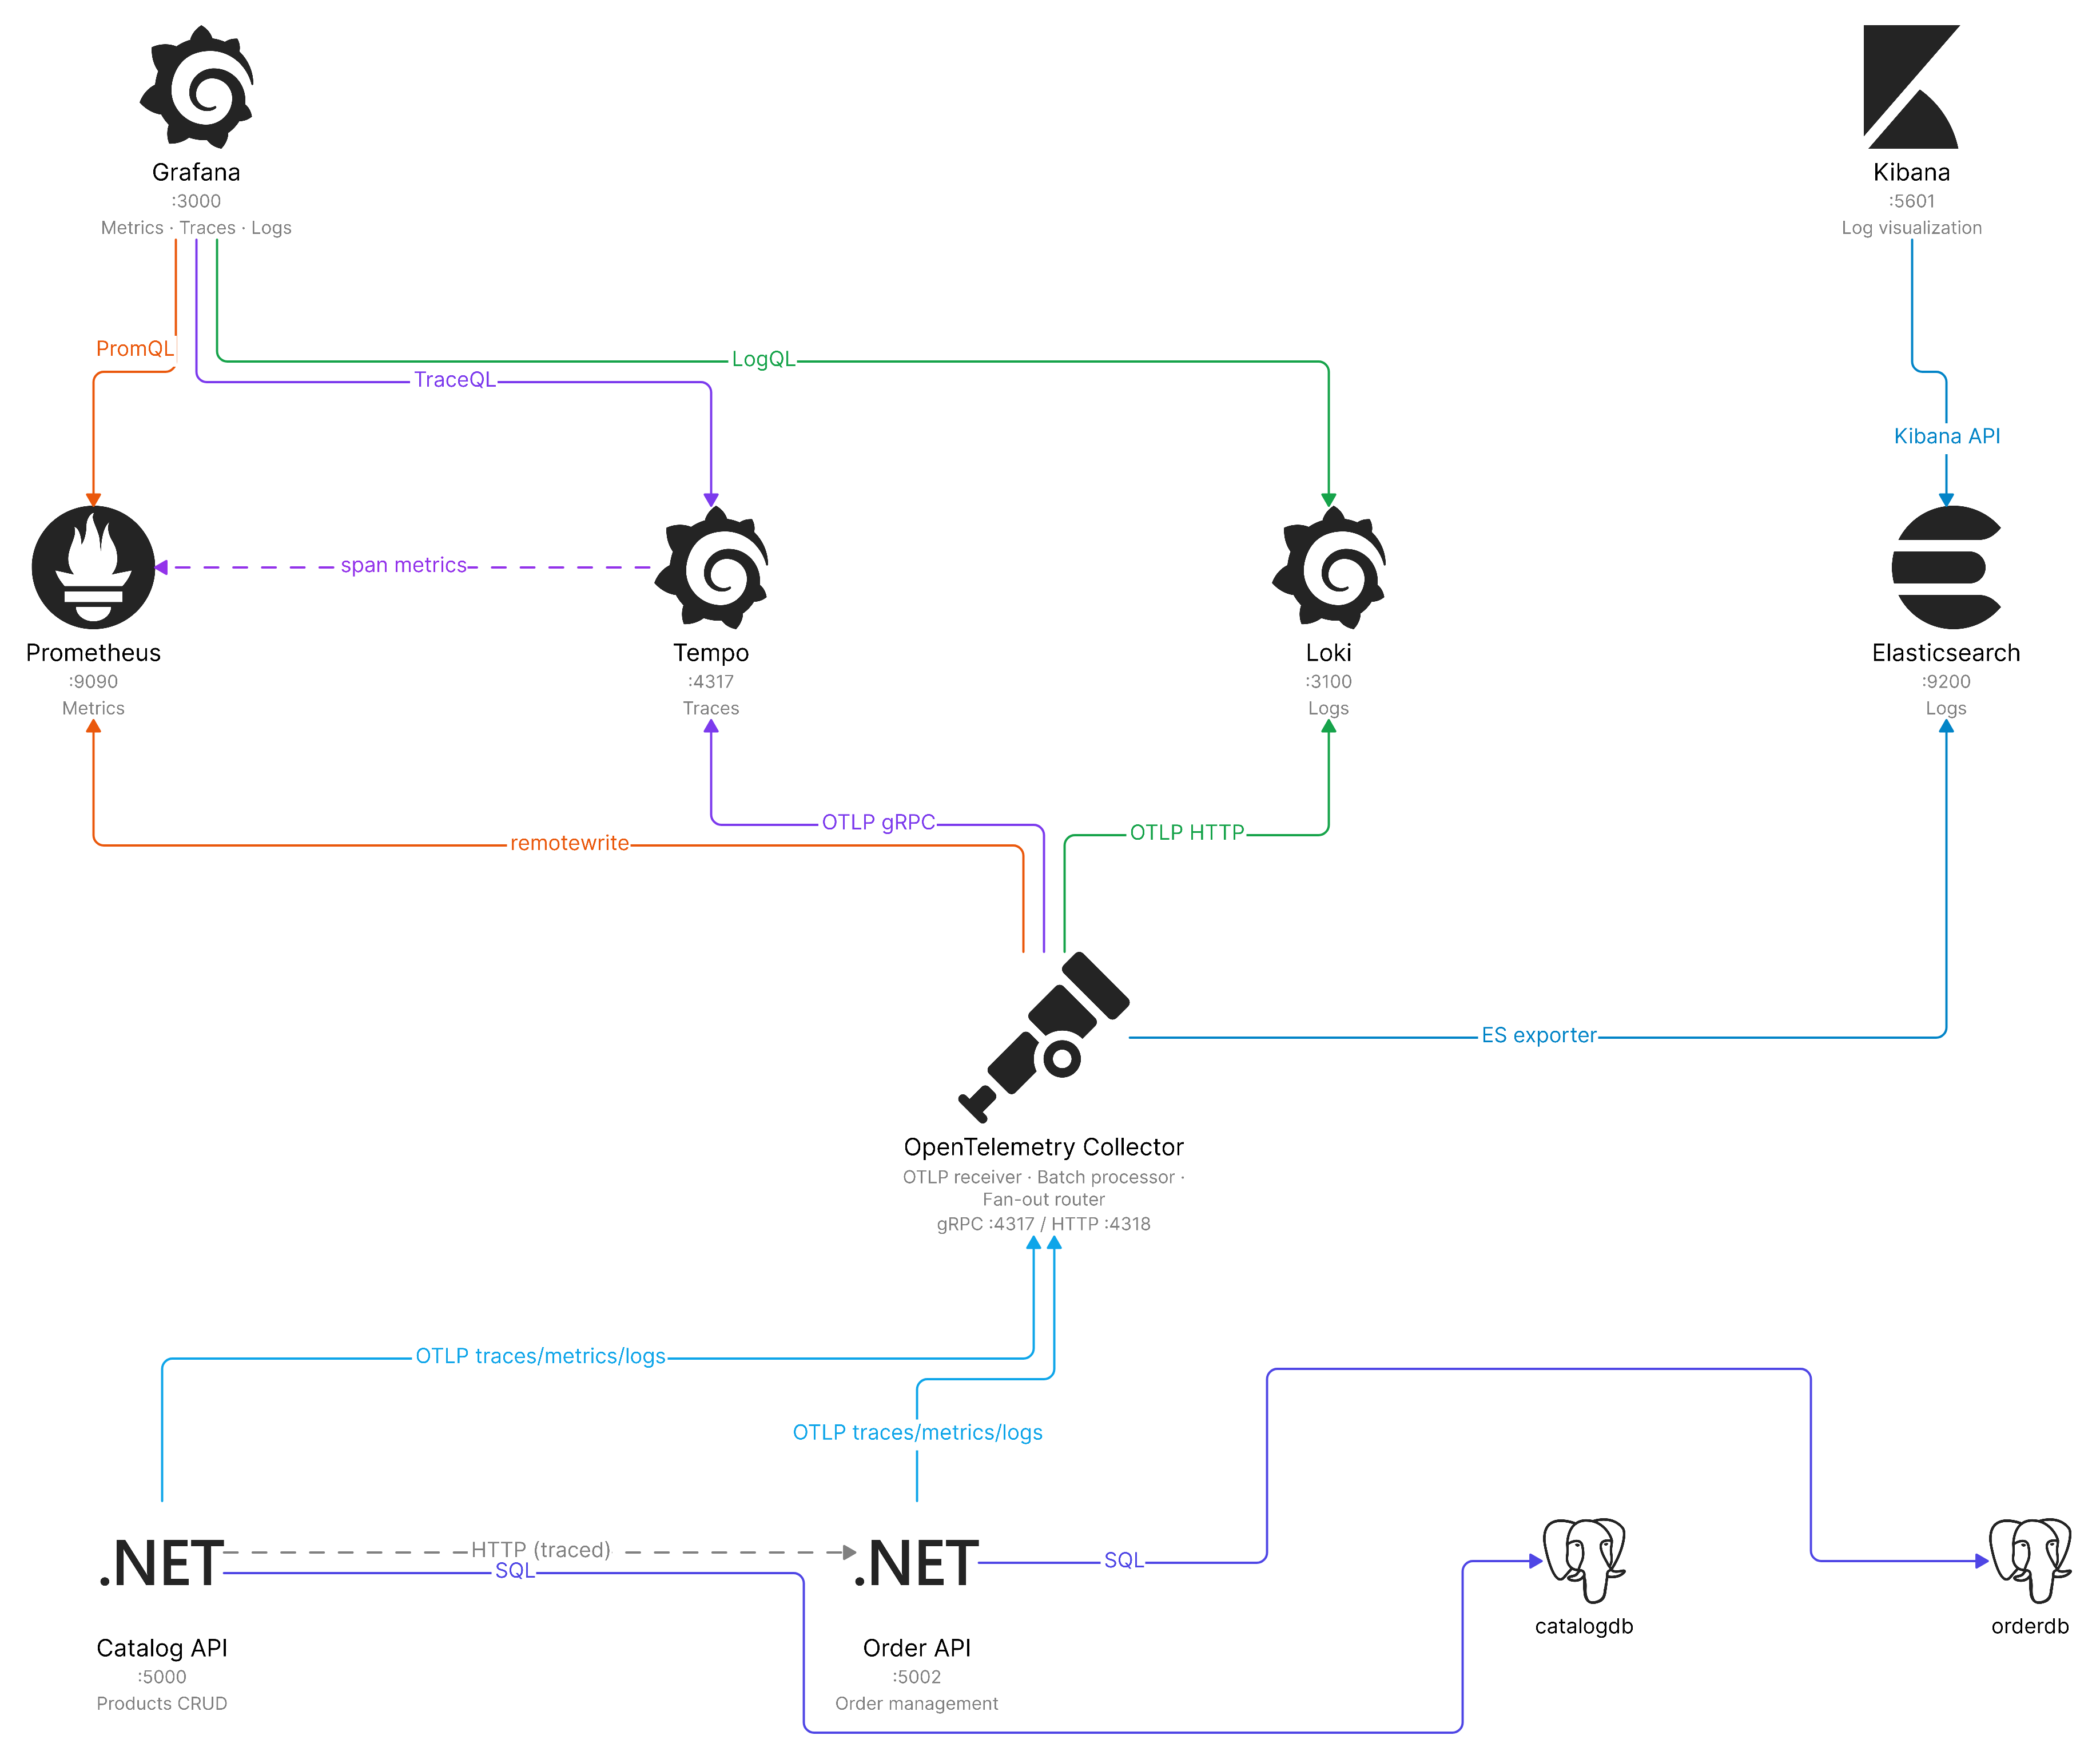
The diagram below shows our full setup. Two .NET services (Catalog on :5000, Order on :5002) each have their own PostgreSQL database. Both send telemetry to the OpenTelemetry Collector, which fans it out: metrics to Prometheus, traces to Tempo, logs to Loki and Elasticsearch. Grafana queries all three backends for a unified view; Kibana provides a dedicated log interface.
How Data Moves Through the Stack
Let’s walk through each connection to see how telemetry flows:
1. Apps → OpenTelemetry Collector
Both .NET apps send traces, metrics, and logs to the collector using the OTLP protocol over gRPC (port 4317). One endpoint handles all three — no need for separate agents.
2. Collector → Prometheus (Metrics)
The collector pushes metrics to Prometheus at /api/v1/write using the prometheusremotewrite exporter. Prometheus needs the --web.enable-remote-write-receiver flag to accept pushes. This is different from the usual Prometheus “pull” model — the collector controls when data is sent, which works better in container environments where services come and go.
3. Collector → Tempo (Traces)
Traces go to Tempo via OTLP gRPC on port 4317. Tempo stores them and exposes a query API on port 3200. Tempo’s metrics generator is important: it looks at incoming spans and creates span metrics (request rate, error rate, duration) and service graph data, then writes these to Prometheus. You get service dashboards and dependency graphs without extra code.
4. Collector → Loki (Logs)
Logs are sent via OTLP HTTP to Loki at /otlp. Since Loki 3.x, Loki natively accepts OTLP-formatted logs — no need for a Promtail or fluent-bit intermediary. The collector batches logs with a 1s timeout for efficiency.
5. Collector → Elasticsearch (Logs — Alternative Path)
The same logs are also exported to Elasticsearch via the collector’s elasticsearch exporter. This gives you a second log storage backend, queryable through Kibana. Having both Loki and Elasticsearch lets you compare approaches or use Grafana for operational dashboards (via Loki) and Kibana for deep log analytics (via Elasticsearch).
6. Tempo → Prometheus (Span Metrics)
This is a key interaction that often goes unnoticed. Tempo’s metrics_generator reads incoming spans and computes:
- Service graph edges — which services call which, request count, error rate
- Span metrics — RED metrics per endpoint, per status code
- DB query metrics — if spans contain DB span attributes
These computed metrics are remote-written to Prometheus, enabling the Service Graph view in Grafana’s Tempo datasource without any custom instrumentation.
7. Grafana → Prometheus, Tempo, Loki
Grafana is provisioned with three datasources:
- Prometheus (default) — for metric queries and alerting
- Tempo — for trace exploration via TraceQL, with the Prometheus datasource linked for service-map lookups
- Loki — for log exploration via LogQL, with derived fields that extract trace IDs from log lines and link directly to Tempo traces
8. Kibana → Elasticsearch
Kibana connects to Elasticsearch on port 9200 and provides the familiar Discover UI for log searching, filtering, and dashboarding. Both Loki and Elasticsearch receive the same log data from the collector, so you can choose your preferred tool.
Here’s a summary of all ports and protocols:
| Component | Port | Protocol | Used By |
|---|---|---|---|
| OTel Collector | 4317 | OTLP gRPC | .NET apps (traces + metrics + logs) |
| OTel Collector | 4318 | OTLP HTTP | Fallback ingestion |
| Prometheus | 9090 | HTTP API | Grafana queries + remote write |
| Tempo | 4317 | OTLP gRPC | Trace ingestion |
| Tempo | 3200 | HTTP | Grafana queries |
| Loki | 3100 | HTTP | OTLP logs + Grafana queries |
| Elasticsearch | 9200 | HTTP | Log indexing + Kibana queries |
| Kibana | 5601 | HTTP | User-facing log UI |
| Grafana | 3000 | HTTP | User-facing dashboard UI |
| Catalog API | 5000 | HTTP | Business API |
| Order API | 5002 | HTTP | Business API |
| PostgreSQL | 5432 | PostgreSQL | Data persistence |
Infrastructure Setup with Docker Compose
Here’s the docker-compose infrastructure configuration. Save this as docker-compose.infrastructure.yaml:
|
|
OpenTelemetry Collector Configuration
The collector is the brain of the observability pipeline. It receives OTLP telemetry on port 4317 (gRPC) and 4318 (HTTP), batches it, then fans out to each backend. Save this as configs/otel-collector-config.yaml:
|
|
How the Collector Config Works
The collector has three parts — receivers (inbound), processors (buffer/batch), exporters (outbound) — wired together in pipelines:
- Receivers: The
otlpreceiver accepts gRPC and HTTP. The .NET SDK sends all signals over gRPC by default. - Processors: The
batchprocessor buffers up to 1024 items or waits 1 second, then sends to exporters. This cuts down API calls to backends. - Exporters:
prometheusremotewrite→ metrics,otlp/tempo→ traces,otlphttp/loki+elasticsearch→ logs,debug→ console output for dev. - Pipelines: Three separate paths — traces, metrics, logs. Each pipeline runs receivers → processors → exporters independently.
Prometheus Configuration
Prometheus runs with --web.enable-remote-write-receiver, so it accepts pushed metrics from both the collector and Tempo — not just the usual pull/scrape model.
configs/prometheus.yaml:
|
|
The only scrape target is the collector’s own metrics port (8888). All app metrics come via remote write.
Three sources feed Prometheus:
| Source | Data | How |
|---|---|---|
| OTel Collector (remote write) | App metrics (HTTP duration, GC, etc.) | prometheusremotewrite exporter → /api/v1/write |
| Tempo metrics generator | Span RED metrics, service graph | Tempo computes from traces → remote writes to Prometheus |
| Scrape (port 8888) | Collector internal metrics | Prometheus scrapes /metrics periodically |
Tempo Configuration
Tempo receives OTLP traces from the collector, stores them, and runs a metrics generator that produces service-level RED metrics from traces.
configs/tempo.yaml:
|
|
Tempo Config Interactions
The metrics_generator section connects traces to metrics. It reads every span and creates:
- Span metrics — request rate, error rate, latency per endpoint
- Service graph metrics — which service calls which, with counts and durations
These are written to Prometheus. Grafana’s Tempo datasource uses them for Service Graph and RED metrics panels — no custom code.
stream_over_http_enabled: true lets Grafana stream large traces in real time.
Loki Configuration
Loki 3.x accepts OTLP logs natively — no log shipper needed. Save as configs/loki-config.yaml:
|
|
Key settings: auth_enabled: false for local dev, TSDB index store (v13 schema), and allow_structured_metadata: true so you can filter logs by service.name or service.version.
Elasticsearch & Kibana
Elasticsearch runs single-node with security disabled for local development. The collector sends the same logs here as it does to Loki.
Kibana connects on port 9200 and provides a Discover UI for log search. Open http://localhost:5601, create a data view with pattern logs-* or otel-*, and you’ll see the same logs Grafana shows from Loki.
Grafana Provisioning
Grafana is auto-provisioned with datasources linking to Prometheus, Tempo, and Loki. Save this as configs/grafana/provisioning/datasources/datasource.yml:
|
|
Grafana Config Details
- Tempo datasource:
serviceMap.datasourceUidlinks to Prometheus so Grafana renders the Service Graph tab — shows Catalog→Order topology automatically. - Loki datasource:
derivedFieldsextracts trace IDs from log lines. Click a trace ID in a log → jumps directly to that trace in Tempo. This is logs → traces correlation: spot an error, see the full request path.
Dashboard Provisioning
Create configs/grafana/provisioning/dashboards/dashboard.yml:
|
|
Add community dashboards (aspnetcore.json, aspnetcore-endpoint.json) to configs/grafana/dashboards/ — they visualize request rates, errors, latency, and .NET runtime metrics out of the box.
.NET Application Integration
Now let’s instrument our .NET microservices with OpenTelemetry, using Vertical Slice Architecture.
Project Structure
Two services, same pattern. Each has a class library + an API host:
|
|
Each service follows the same pattern: vertical slice features, clean Program.cs, infrastructure wiring in InfrastructureExtensions.cs.
Clean Program.cs (both services)
Both API projects use the exact same pattern — minimal Program.cs that delegates to AddInfrastructure():
Catalog.Api/Program.cs:
|
|
Order.Api/Program.cs:
|
|
The only difference is which namespace’s InfrastructureExtensions is used.
AddInfrastructure Extension (Catalog)
Here’s the full AddInfrastructure() for the Catalog service. The Order service follows the same pattern with its own DbContext and connection string:
|
|
What each instrumentation does
| Instrumentation | What it captures |
|---|---|
AddAspNetCoreInstrumentation() |
Incoming HTTP — duration, status, route |
AddHttpClientInstrumentation() |
Outgoing HTTP — dependencies, latency |
AddGrpcClientInstrumentation() |
gRPC client calls |
AddRuntimeInstrumentation() |
.NET runtime — GC, CPU, memory, thread pool |
AddOtlpExporter() sends everything to the collector at http://localhost:4317 (default OTLP gRPC).
Connection Strings
Each service has its own database. Catalog uses CatalogDb, Order uses OrderDb.
Catalog.Api/appsettings.json:
|
|
Order.Api/appsettings.json — same structure, but ConnectionStrings.OrderDb points to orderdb.
Cross-Service Tracing
When Catalog calls Order, AddHttpClientInstrumentation() automatically propagates the traceparent header. This creates a distributed trace across both services:
catalog-api: POST /api/products
  └─ http → order-api: POST /api/orders
       └─ npgsql: INSERT INTO orders
In Grafana’s Tempo you see one trace with spans from both services — full request path visible across process boundaries.
Running the Stack
- Start infrastructure:
|
|
- Run the APIs (separate terminals):
|
|
|
|
- Access UIs:
| Service | URL | Credentials |
|---|---|---|
| Grafana | http://localhost:3000 |
admin / admin |
| Kibana | http://localhost:5601 |
— |
| Prometheus | http://localhost:9090 |
— |
| Catalog Swagger | http://localhost:5000/swagger |
— |
| Order Swagger | http://localhost:5002/swagger |
— |
- Generate traffic by calling the API endpoints:
|
|
Exploring Data in Grafana and Kibana
Metrics (Prometheus)
Go to Explore → Prometheus. Try:
http_server_duration_milliseconds_count{http_route=~"/api/.*"}— request ratedotnet_gc_collection_count— GC pressure- Pre-built ASP.NET Core dashboard shows rates, errors, latency, and runtime metrics.
Traces (Tempo)
Select Tempo → Search → filter by Catalog.Api or Order.Api. Each trace shows the waterfall: HTTP → DB calls → downstream HTTP. Create a product in Catalog, and you’ll see the cross-service trace spanning both services in one view.
Logs (Loki)
Select Loki → query:
{service_name="Catalog.Api"}— Catalog logs{service_name="Order.Api"} |= "error"— errors only- Click a
traceIdin any log → jumps to the full trace in Tempo.
Logs (Kibana)
Open http://localhost:5601 → Discover → create a data view (logs-*). Filter by service.name, search for keywords. Kibana gives full-text log search over the same logs Loki ingests.
Debugging Flow
- Dashboard shows error spike
- Click → Explore → Tempo: find the trace
- Trace waterfall shows where time was spent
- Click log line → Loki: see the error with stack trace
- Deep dive → Kibana full-text search across historical logs
Conclusion
OpenTelemetry + Grafana stack gives you metrics, traces, and logs across your microservices — with zero vendor lock-in. Instrument once with the OTel SDK, the collector routes signals to all backends.
Key takeaways:
- OTel Collector decouples your code from backends — three independent pipelines for traces, metrics, logs
- Tempo’s metrics generator turns spans into RED metrics and service graphs automatically
- Loki 3.x OTLP means no log shipper — the collector sends logs directly
- Dual log backends — Loki for dashboards, Elasticsearch/Kibana for full-text search
- One
AddInfrastructure()call wires up OpenTelemetry, EF Core, MediatR, Swagger per service - Cross-service tracing works automatically with
AddHttpClientInstrumentation()
The complete sample code is available in the repository below, including both microservices, all deployment configs, and pre-built Grafana dashboards.
You can find the sample code in this repository:
🔗 https://github.com/meysamhadeli/blog-samples/tree/main/src/otel-observability-sample