
When you build a .NET application that calls an LLM, the hard part is rarely the first API call. The hard part starts after you deploy. How many tokens did each user consume? Which prompts are failing? How long do chat completions take? Why did a tool-calling chain produce the wrong result for one user but not another?
Traditional observability tools give you generic HTTP spans and CPU metrics, but they don’t understand LLM-specific signals like token usage, model name, temperature, prompt text, tool calls, or finish reason. That’s where Langfuse comes in.
Langfuse is an open-source LLM engineering platform that provides observability, evaluation, prompt management, and analytics. It supports OpenTelemetry natively, which means you can instrument your .NET GenAI application once and get structured LLM traces, metrics, and logs in one dashboard.
In this post, I’ll show how to instrument a .NET Web API that uses Semantic Kernel for chat completions via DeepSeek (OpenAI-compatible API), with Langfuse as the observability backend. The sample uses:
- Microsoft.SemanticKernel — orchestration layer for LLM calls and tool invocation
- DeepSeek — chat model via OpenAI-compatible endpoint
- LangfuseDotnet — OpenTelemetry exporter for Langfuse
- OpenTelemetry — traces, metrics, and structured logs
- Custom meters — LLM-specific metrics (token count, latency, request rate)
What Langfuse Gives Us for GenAI Workloads
Standard observability backends treat all spans equally. A chat completion request looks like any other POST /api/v1/chat span. You lose the GenAI-specific context that matters for debugging and optimization.
Langfuse bridges that gap. It follows OpenTelemetry GenAI semantic conventions, so the SDK knows how to structure LLM telemetry:
- Traces — full trace of a chat request with nested spans for tool calls, retrievals, and generations
- Generations — LLM-specific observations with model name, provider, temperature, max tokens, input/output messages, token counts, and finish reason
- Metrics — request counts, latency histograms, per-model token usage
- Logs — structured application logs correlated with traces via trace IDs
All of this works through standard OpenTelemetry exporters. The Langfuse exporter is just another OTLP destination that understands GenAI conventions.
Getting Started: Package Setup
We need these packages in the project:
|
|
The Langfuse SDK (zborek.Langfuse) bundles the OpenTelemetry exporter, GenAI semantic convention helpers, and the IOtelLangfuseTrace service for scoped tracing.
Semantic Kernel preview warnings are suppressed so the build stays clean:
|
|
Running Langfuse Locally with Docker Compose
Langfuse is an open-source platform, so you can run it locally instead of relying on a managed cloud instance. The sample repository includes a docker-compose.yml that starts everything needed for local development:
|
|
The compose file starts Postgres, ClickHouse, MinIO, Redis, the Langfuse worker, and the Langfuse web UI. The web UI is exposed on http://localhost:3001.
It also seeds a default organization, project, and user account:
- Email:
[email protected] - Password:
LangfuseDemo2026!
The sample’s appsettings.json already points to the seeded local project, so no manual key configuration is needed. The compose file sets both LANGFUSE_INIT_ORG_ID and LANGFUSE_INIT_PROJECT_ID; without these IDs Langfuse skips the seeding step.
|
|
The application checks for the Langfuse keys at startup. If they are empty, the exporter is not registered and the API still runs normally — it just does not send traces to Langfuse. This is useful for local development without the compose stack.
No Aspire orchestration is required. The sample is a plain ASP.NET Core project, and the compose stack is self-contained.
Configuring Langfuse with OpenTelemetry
The wiring happens in Program.cs. We register OpenTelemetry with the Langfuse exporter, and then register the scoped trace service:
|
|
The AddLangfuseExporter call reads these settings from appsettings.json:
|
|
Setting OnlyGenAiActivities to false keeps infrastructure spans (HTTP client, ASP.NET Core, and our custom tool-call activity source) visible alongside GenAI spans. If you set it to true, Langfuse filters out non-GenAI spans, which hides the tool-call child observations.
Setting Up Semantic Kernel with DeepSeek
Semantic Kernel handles the chat completion service, the plugin registry, and the automatic tool-calling loop. The DeepSeek API is OpenAI-compatible, so we use the OpenAI connector with a custom endpoint:
|
|
The same pattern works for any OpenAI-compatible provider — just change the Endpoint URL and model name. Because Semantic Kernel owns the abstraction, switching providers is a one-line change.
System Architecture
Here is how the components fit together:
The flow is straightforward: HTTP requests hit the minimal API endpoints, which delegate to ChatService. That service calls DeepSeek through Semantic Kernel and emits OpenTelemetry spans, metrics, and logs. The Langfuse exporter picks up GenAI-specific spans and sends them to Langfuse.
Instrumenting Chat Completions with Langfuse
The ChatService integrates Langfuse tracing alongside Semantic Kernel calls. Here is the full pattern:
|
|
The pattern covers all three pillars of observability:
- Traces — Semantic Kernel’s built-in instrumentation emits a trace with nested generation observations, and the custom
ActivitySourceinWeatherPluginemits child spans for each tool call. - Metrics — custom counters track request rate and token usage. A histogram tracks latency distribution. These can be scraped by Prometheus and visualized in Grafana for operational dashboards.
- Logs — structured logs with session IDs and user IDs make it easy to correlate log entries with specific traces.
Adding Tool Calling with Semantic Kernel
Most real-world GenAI applications need more than text generation — they need the model to query databases, call APIs, or fetch live data. Semantic Kernel handles this with plugins and ToolCallBehavior.
The pattern has three parts:
1. Define a plugin with KernelFunction
Use a public method decorated with [KernelFunction] and [Description] to expose a callable tool. The method’s parameters and return type are automatically described to the model:
|
|
2. Register the plugin in Program.cs
Add the plugin to the kernel:
|
|
3. Enable auto-invocation in execution settings
Tell Semantic Kernel to automatically call the tool when the model requests it:
|
|
When the model decides it needs weather data, the flow is:
- Model returns a
get_weatherfunction call request instead of a text response - Semantic Kernel invokes the
WeatherPlugin.GetWeathermethod - The result is sent back to the model in a second round
- Model produces the final text response using the tool output
- The whole exchange appears as one trace with nested tool-call observations
Langfuse captures the tool call as a separate child observation. You can see the tool inputs (city name) and outputs (weather string) alongside the final model response — all correlated in one trace.
Tool Calling in the Langfuse Trace
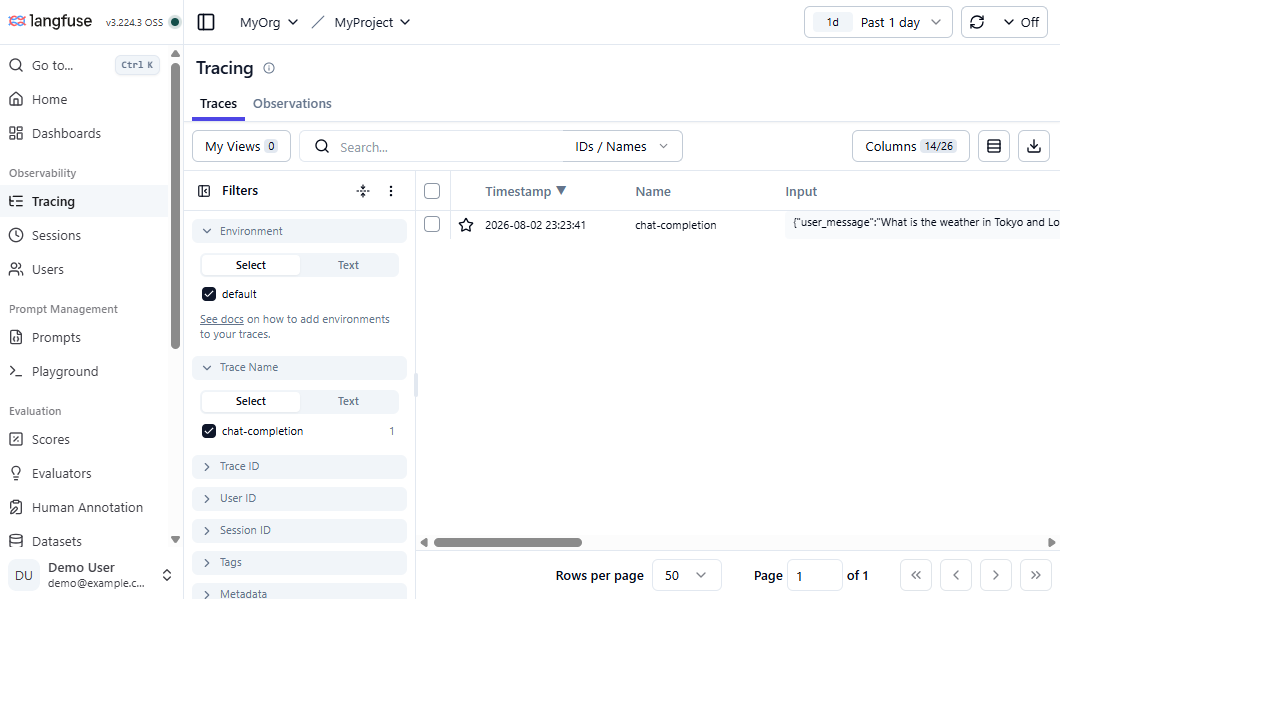
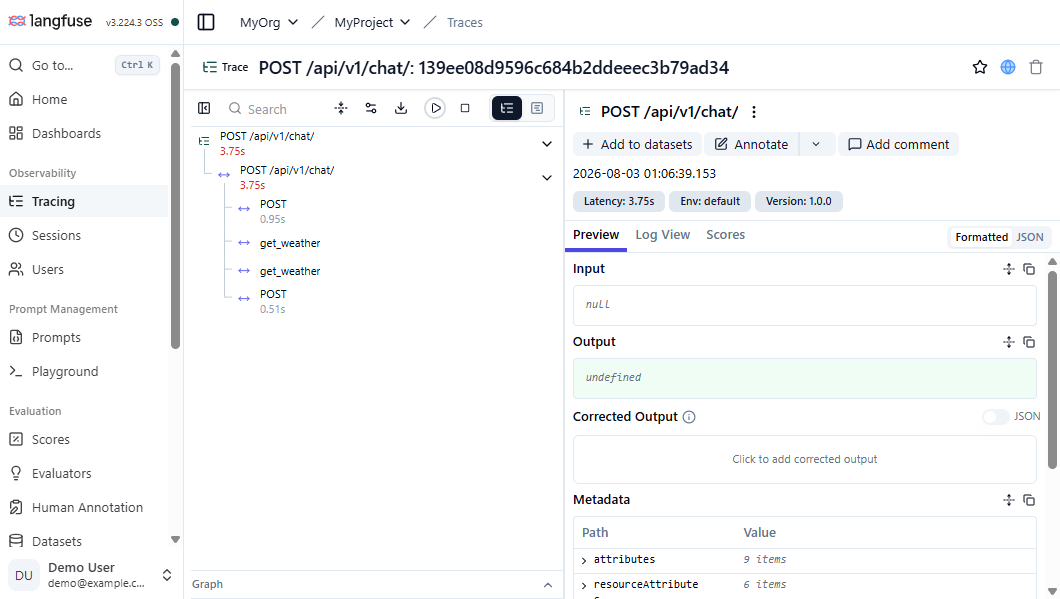
This is the dashboard view readers should focus on: one root chat request, one or more generation spans, and get_weather child span(s) under the same trace.
Below is the Langfuse traces list. Each row is one request; the observation count tells you whether tool calls were captured as separate spans.
Opening the newest trace shows the full tree: the root POST /api/v1/chat/ span, the chat-completion span, the HTTP POST spans to DeepSeek, and the nested get_weather tool-call activity.
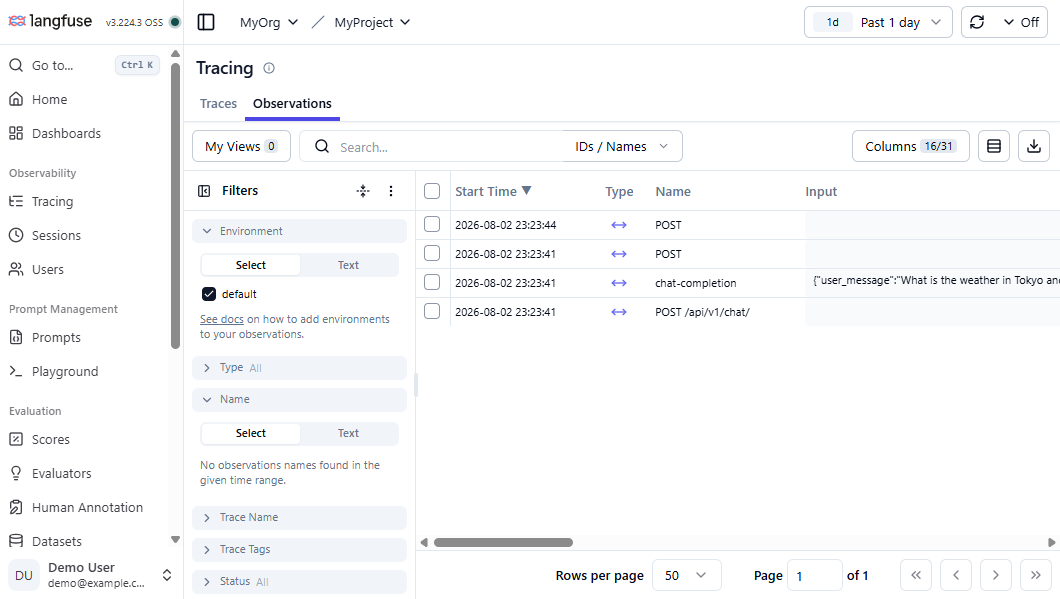
The Observations view lists every individual span across all traces, making it easy to filter for tool calls or generations.
What You Get in the Langfuse Dashboard
After running the sample and sending a few chat requests, Langfuse shows:
Traces view: Each chat request appears as a trace with the full input/output, model metadata, token counts, latency, and nested tool-call observations. When weather tool calling is active, the trace shows the get_weather child span under the root request.
Observations view: Every span is listed independently. You can filter by type (SPAN, GENERATION), name, or time range to inspect tool calls, HTTP calls, or model generations.
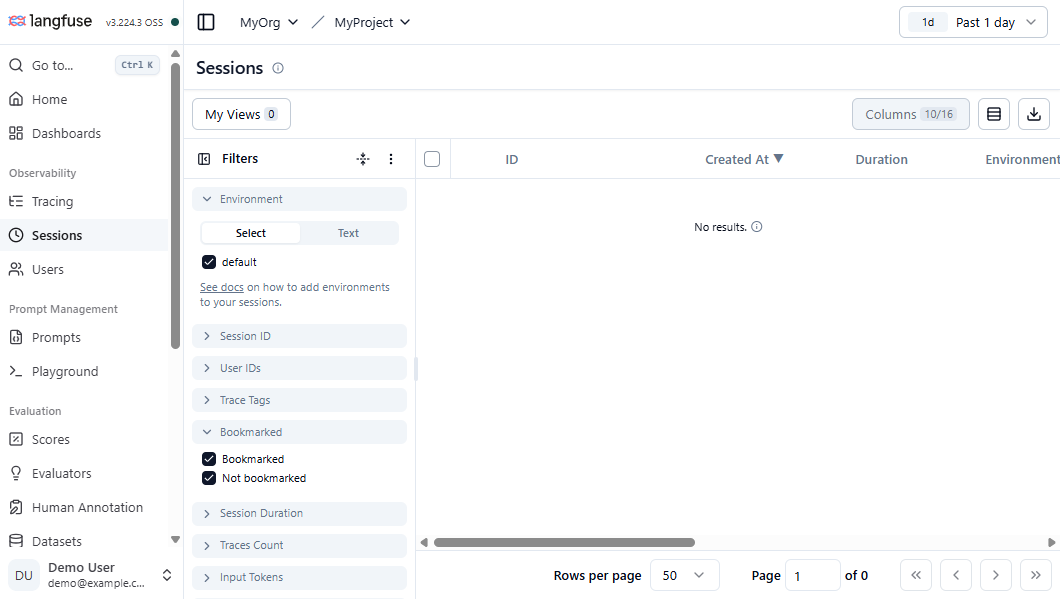
Sessions view: By passing sessionId in the request, Langfuse groups all traces from a single user session. This helps debug multi-turn conversations and identify UX issues.
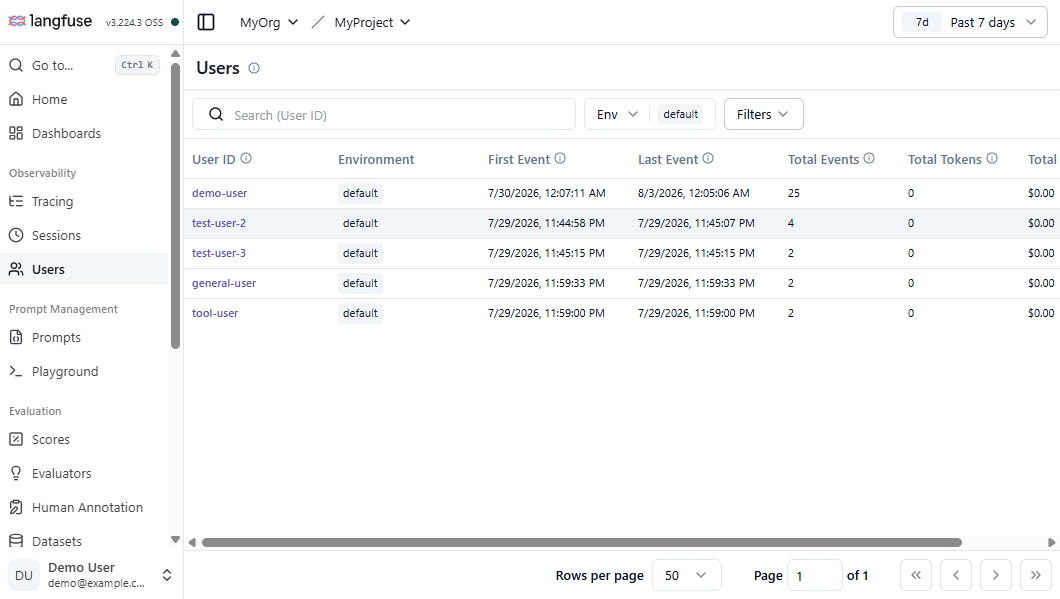
Users view: Passing userId lets you see per-user activity, total events, and estimated cost over any time range.
Metrics: Custom metrics like request count, latency histograms, and token counters integrate with Prometheus for alerting. Set an alert when token consumption exceeds a threshold or when p95 latency goes above 5 seconds.
Connecting Logs to Traces
The structured logs emitted by ILogger<ChatService> contain SessionId and UserId properties. When combined with OpenTelemetry logging, each log record inherits the trace ID from the current activity context. This means you can jump from a Langfuse trace directly to the correlating log entries in Loki or Elasticsearch, even when the trace includes tool calls.
To enable OpenTelemetry logging, add the OTLP log exporter in Program.cs:
|
|
With that in place, every LogInformation call is enriched with TraceId, SpanId, and resource attributes automatically.
Conclusion
LLM observability needs more than generic HTTP tracing. Langfuse gives .NET developers a purpose-built platform that understands GenAI semantics — model names, token counts, prompt/response pairs, temperature, finish reasons, and tool-call spans — all through standard OpenTelemetry exporters.
The integration with Semantic Kernel means you don’t need to choose between clean abstractions and deep observability. You get both: the kernel handles chat completions and the tool-calling loop, while OpenTelemetry and Langfuse capture the full execution graph in the dashboard.